

Much has been written and re-written on the jobs situation in India in the past few weeks. Many accusations and counter accusations on the reliability of data and suppression of government reports on employment have been in the news. In fact 108 Economists and Social Scientists have published a joint statement expressing anguish over the suppression of reports on employment[1]. They contend that the integrity of the institutions that produce these data for decades cannot be questioned. All said and done the situation looks grim to say the least.
In this note I highlight two issues: First, the continued and sharp decline in the female work participation rate and second, the continuous shrinking of employment in the informal sector. These trends may have been aggravated since two drastic economic measures were undertaken, demonetization in November 2016 and introduction of the goods and services tax (GST) in July 2017.
Over the last few decades the National Sample Survey Organisation (NSSO) data on Employment and Unemployment have been recording a decline in the participation of women in the work force. This has been explained mainly by two opposing views. One view is that the decline is due to increasing average household incomes in the country with the growth of the economy resulting in women withdrawing from the labour force. This is known as the ‘income effect’. Further, with rising incomes girls may continue into tertiary education rather that entering the labour market. The opposing view is that this decline in female labour force participation reflects a ‘discouraged worker effect’ arising from the lack of demand. Such a situation arises when the employment situation is bleak so that women prefer to opt out of the labour market and not offer themselves for work.
Women’s participation in the labour force has been very low in India, much more so in urban areas. The new Periodic Labour Force Survey (PDLF), which has not yet been officially released, showed a further sharp decline in women participation in the work force in 2017-18 (Table 1). The decline was particularly sharp in rural areas falling from 25 percent in 2011-12 to 18 percent in 2017-18. Women’s participation in urban areas more or less maintained its low rate at nearly 16 percent for all ages and 20 percent for 15 years and above in 2017-18.
There was a sharp increase in the unemployment rate as recorded by the Periodic Labour Force Survey (PLFS) of the NSSO. The current weekly unemployment rate was at a high of 9.1 percent for females and 8.8 percent for males[2].
Table 1: Women’s Work Force Participation, Rural and Urban (Percentage)
| Work Participation | ||||
| Rural | Urban | |||
| Year | All ages | 15 years+ | All ages | 15 years+ |
| 2017-18* | 18.2 | 24.6 | 15.9 | 20.4 |
| 2011-12 | 25.3 | 35.8 | 15.5 | 20.5 |
| 2004-05 | 33.3 | 49.4 | 17.8 | 24.4 |
| Source: Various rounds of NSSO, * PLFS, Indian Express, March 25, 2019 |
The Consumer Pyramids Survey is a large household survey conducted by the Center for Monitoring the Economy (CMIE), a private agency. Most labour economists did not rely on this source of data till the recent controversy of non-disclosure of the national labour force statistics reports arose. The CMIE data has a unique advantage that it presents quarterly estimates of employment, unlike the estimates of the NSSO which appeared once every five years. I would still trust the NSSO data for accurate estimates of the labour force, but the CMIE data has a relatively large sample size to warrant attention[3].
The CMIE quarterly estimates for the years 2016, 2017 and 2018 included the period when the two major economic shocks occurred, demonetisation and introduction of the goods and services tax (GST). According to the CMIE survey on employment the absolute number of workers showed a decline after the quarter ended December 2016 marking the shock of demonetisation. Absolute number of workers declined again in the quarter ended September 2017 in the period after the introduction of GST (Table 2). Overall there was a decline in employment from 385 million from the quarter ended December 2016 to 375 million in the quarter ended December 2018, a loss of 10 million jobs. The unemployed rose sharply in the quarter ended December 2016, immediately after the first shock.
Table 2: Number of Workers by Occupation Groups, Quarterly Estimates, 2016, 2017, 2018
| Quarter ended | Business | Salaried | Small traders & Wage workers | Farmers | Work Force | Unemployed |
| Mar-16 | 45,336,981 | 80,069,308 | 153,855,042 | 91,015,835 | 370,277,166 | 823,010 |
| Jun-16 | 46,967,482 | 80,333,505 | 160,564,135 | 88,710,403 | 376,575,525 | 1,063,057 |
| Sep-16 | 44,948,098 | 78,371,796 | 169,209,974 | 87,015,189 | 379,545,057 | 3,194,297 |
| Dec-16 | 46,151,858 | 81,097,656 | 162,436,786 | 95,733,617 | 385,419,917 | 3,223,445 |
| Mar-17 | 47,886,434 | 74,840,575 | 157,983,241 | 98,676,937 | 379,387,187 | 1,992,382 |
| Jun-17 | 51,322,602 | 75,451,365 | 154,566,704 | 97,887,813 | 379,228,484 | 2,641,519 |
| Sep-17 | 54,023,609 | 80,646,551 | 147,434,739 | 98,107,307 | 380,212,206 | 2,212,771 |
| Dec-17 | 58,809,500 | 81,682,856 | 150,088,595 | 96,988,136 | 387,569,087 | 2,608,330 |
| Mar-18 | 58,793,971 | 80,211,478 | 140,749,592 | 97,812,563 | 377,567,604 | 2,187,612 |
| Jun-18 | 60,185,831 | 80,346,530 | 140,084,176 | 99,065,204 | 379,681,741 | 2,182,270 |
| Sep-18 | 62,335,672 | 80,436,144 | 134,634,881 | 101,340,816 | 378,747,513 | 2,195,138 |
| Dec-18 | 63,777,937 | 79,296,690 | 129,380,401 | 102,793,887 | 375,248,915 | 3,105,462 |
Source: CMIE Household Consumer Pyramid Data
It is interesting to see which occupation groups or trades suffered the major loss of employment during this period. The CMIE Survey does not follow the standard international occupational classification of professionals, managers, technicians, service and sales workers, clerical, agriculture, crafts, plant and machine operators and elementary occupations (ISCO-8[4]). It has created a strange set of four occupational groups, business, salaried employees, farmers and has clubbed small traders and wage workers into a fourth group.
We assume that the occupation group small traders and wage workers are engaged in work in the informal sector. There is a sharp decline in small traders and wage workers from 162 million in the quarter of December 2016, period of the first shock of demonetisation, to 129 million in December 2018 covering the period of the second shock of introduction of GST (Table 2). This is a loss of 34 million jobs during the period.
It can be argued that some of the informal traders registered their enterprises with GST during this period and joined the occupational group ‘business’ and can be broadly categorized as being in the formal sector. Similarly, some of the wage workers may have registered in the Employees Provident Fund Organisation (EPFO) and joined the ranks of formal salaried employees as claimed officially[5]. Even if this were so, the small increase in businesses of about 27 million (Table 2) and no perceptible increase in salaried employment cannot account for the loss of 34 million small trade and wage jobs during the period from quarters ending December 2016 to December 2018.
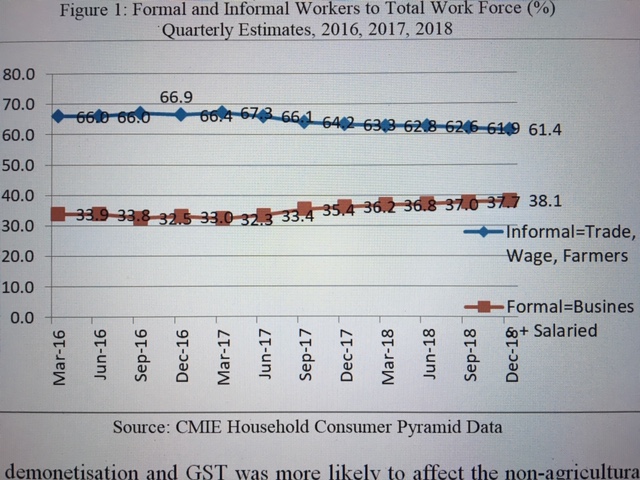
If we include farmers to the small traders and wage workers to the total work force in the informal sector we note a slow decline in the share after demonetisation from the quarter ended December 2016 (Figure 1). The decline in the share of workers in the informal sector due to the impact of GST was sharper and visible from the quarter ended September 2017. Overall there was a fall in share of informal sector, including farmers in rural areas, from 66.9 percent in December 2016 to 61.4 percent in December 2018 (6.5 percentage points). The rest of the occupational groups, engaged in business and salaried employees were deemed to be in the formal sector. There was an increase in the share of the formal sector mirroring the decline in the share of the informal sector.
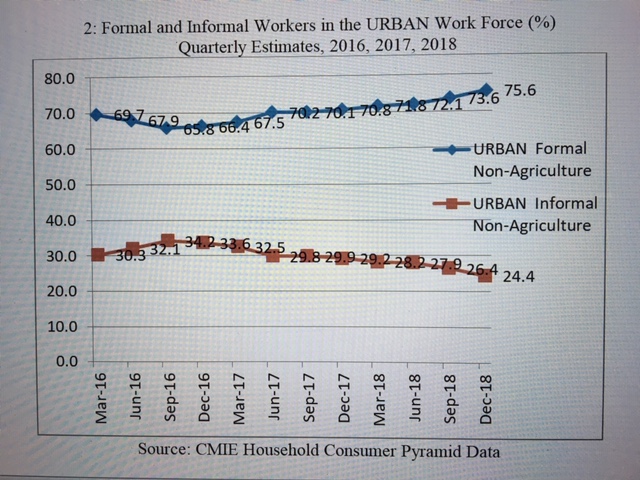
The impact of demonetisation and GST was more likely to affect the non-agricultural workers in urban areas. For urban areas we define informal sector to include small traders and wage workers and exclude farmers. The share of the informal sector consisting of small traders and wage workers, showed a decline after the first shock of demonetisation in the quarter ended December 2016 (Figure 2). There was a sharp decline in the share of workers in the informal sector after the second shock of GST from the quarter of September 2017. The share of informal trade and wage work in urban areas shrank continuously from 34.2 percent in the quarter of December 2016 to 24.4 percent in December 2018 (10 percentage points) and, as noted earlier, in absolute employment as well.
With
an overall decline in absolute number of workers of 10 million, according to
the CMIE estimates, it is clear that the economy went into a slump with the two
economic shocks of demonetisation and introduction of GST. Among the
occupational groups the small enterprises, traders and wage workers were worst
affected by the two economic shocks. It is intriguing that the women’s
participation fell sharply in rural areas, but not in urban areas, even though
there was a sharper fall in share of the informal work force in urban areas. Various
states of India have faced successive droughts since 2016-17[1]. It
is likely that the discouraged worker effect, due to the drought conditions and
partly due to the shocks, was stronger in rural areas leading to the sharp decline
in women’s participation.
[1] https://economictimes.indiatimes.com/news/economy/policy/8-states-declared-drought-affected-centre-allows-them-to-offer-50-days-of-extra-work-under-nregs/articleshow/58037760.cms?from=mdr
[1] https://economictimes.indiatimes.com/news/economy/policy/8-states-declared-drought-affected-centre-allows-them-to-offer-50-days-of-extra-work-under-nregs/articleshow/58037760.cms?from=mdr
[1] The WIRE, March 14, 2019 https://thewire.in/economy/108-economists-social-scientists-raise-red-flags-over-interference-in-data-estimation
[2]The WIRE, February 1, 2019 https://thewire.in/labour/unemployment-after-demonetisation-gst-was-even-more-than-6-1-report
[3] The estimates from CMIE came to my attention when it was presented by the students of my under-graduate class as part of an assignment on Statistics on the Informal Economy in the course titled Urban Informal Economy at Ahmedabad University. Credits for compiling data and creating graphs go to my students, Hariom Tiwari, Lokesh Kothari, Jainam Sheth, Hiren Kothari, Sneh Patel and Jayraj Jadav.
[4] https://www.ilo.org/public/english/bureau/stat/isco/isco08/
[5] https://www.news18.com/news/business/7-16-lakh-jobs-created-in-december-72-32-lakh-in-last-16-months-epfo-payroll-data-2043281.html

One thought on “What does declining women’s participation and shrinking informal sector tell us?”